Background & Highlights
- Weather data was frequently used at DeepLabs but was not properly managed
- Providing standardized weather data was expensive and challenging
- We saved $
Body
At DeepLabs, weather data was essential since it provided strong signals for majority of our fraud detection & behavior models. Despite its importance, weather data was not managed properly and Data Scientists were collecting weather data from various sources that often overlapped in range and measurements (For example, certain weather dataset would be collected in hourly intervals while other weather dataset were collected on daily interval, another weather dataset was collected in Celsius while other weather dataset was collected in Fahrenheit). Although it wasn’t ideal, our internal users coped with this process until the team started to grow and many data scientists spent more time asking each other for the location of ad-hoc weather datasets that were either stored in local machines or temporary google cloud storage.
This was problematic and we wanted to provide efficiency for the data scientists by setting up data pipelines to regularly provide quality weather data in an easily accessible location so that data scientists can better focus on solving business problems.
Sounds simple right? However, obtaining weather data was not as easy as we thought. First, the scope of collecting weather data was not defined. We wanted US weather data, but at which granularity? At the city level? State level? County level? Zip code level? Second, what type of measurements do we want? There are hundreds of weather metrics available like windspeed, visibility, uv index, humidity, temp, etc. Last, what about the frequency? Do we need it at the hourly level or daily level? If hourly, do we need ingest the weather data every hour or can we ingest it on a daily basis? What about weekly? From the user perspective, it is natural to say “I want everything available for me right here right now!” But the reality is that we have a business to run and don’t want to break the bank. Unlike airlines or logistics business that might actually need the latest weather data on a minute basis, we were in the fraud detection space where daily or weekly ingestion of data might suffice. The key here is finding the right balance and achieving efficiency.
After few meetings with the data scientists, we were able to clarify some key requirements:
- US Hourly weather data for key metrics like temp, wind speed, uv index, sunrise/sunset time, etc.
- Ingestion at the US city & county level that is determined by FIPS (Federal Information Processing System)
- Weekly ingestion frequency
- Backfill ~5 years worth of weather data if possible
With these requirements, we proceeded to find the ideal source and method to setup data ingestion pipeline. However, we ran into some issues quickly and realized that ingesting weather data for all US cities at the hourly level can be an expensive task both financially and systematically. To provide some perspective, there are ~20,000 US cities and to ingest weather data for all the US cities every hour meant ~ 480k API calls on a daily basis. If we were to naively assume that each API call costs $0.001, this meant ~$480 on a daily basis… yikes.
Rather than despair, the data team saw this as an opportunity to provide value. Our first step was to seek various weather data vendors like openweather, darksky, tomorrow.io, etc. for the best deal that satisfies our requirements. Upon our initial research we were able to learn that we could leverage darksky's (now acquired by Apple and discontinuing at the end of 2022) weather data API to ingest hourly weather data on a daily basis. This meant that a single API call each day for a US city will contain 24 hours worth of hourly weather data in a nested JSON response. To simplify this in plain English, as long as we don’t need an updated hourly weather data on a real time basis, we can make a single API call to get 24 hours of hourly weather data instead of making 24 API calls for the same day. Our estimated daily cost went down from ~$480 to ~$20. Big difference in terms of price, but we also realized that there were room for improvement as we thought further about how weather data was collected by the vendors.
We’re so accustomed to looking up weather info by our location that we fail to realize that not all cities have active weather stations collecting and measuring data. Upon further research of NOAA (National Oceanic and Atmospheric Administration), we discovered that weather data is measured and collected from ISD (Integrated Surface Database) stations across the world. To further verify this finding, we’ve also noticed that NOAA ISD stations were listed as a data source for major weather data vendors. Additionally, the city sizes in United States are not uniform. There will be big cities while some cities will be very small in terms of sqft. For example, there could be two small cities that are so close to each other that the two cities will likely have highly similar weather metrics and measurements. For cases like these, it’s inefficient to make separate API calls as long as there aren’t major difference between the two separate API calls.
With this thought process, we started digging into NOAA for more information and discovered a list of all ISD stations worldwide (~29,610 stations). Since we were only interested in US, we applied the filters below to narrow down the list of stations to US only.
- Filter the
Country Codecolumn to US only - Filter for recently updated stations only by applying
end > 21/6/1 - Filter out inactive stations with
WBAN = 99999
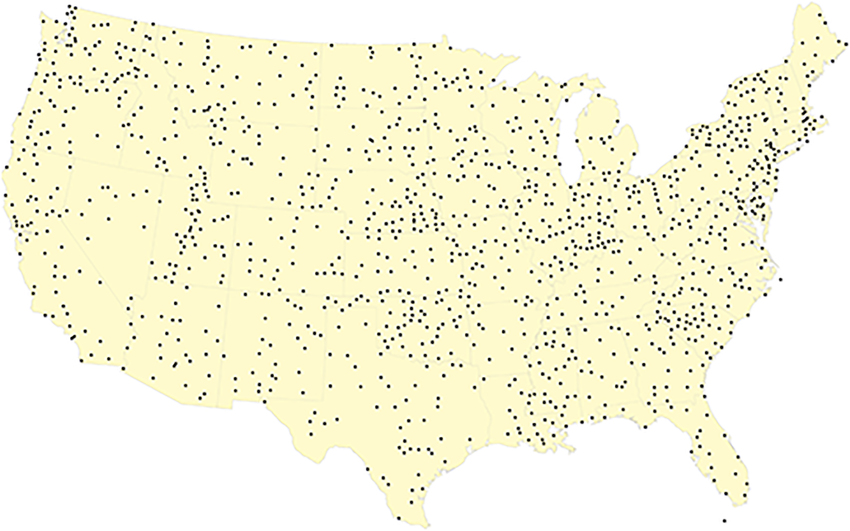
With the filters applied, we were able to narrow down the list of ISD stations to 2,232 active US stations! Considering that there are ~20,000 cities in the United States, the number of active ISD stations was less than what we expected. Given this information, we were curious to see whether the weather information gathered from the 2,232 active US ISD stations was sufficient to cover the weather information gathered directly from ~20,000 cities. Since we had the lat/long coordinates for both cities and active US ISD stations, we were able to use the DarkSky API to collect hourly weather data for both geographical level at the same time period. In order to make this experiment possible, we had to map each US city to the nearest active US ISD station and obtain the weather data for both city level and US ISD station level on the same time range. There are ~20,000 US cities and mapping each city to the closest US ISD station manually was going to be a pain. In order to automate the process, we looped through each US cities and mapped the closest US ISD stations by applying haversine formula to find the closest US ISD stations. Now that the stations are mapped, we collaborated with the DS team to measure the difference in weather metrics between the API calls from US cities and ISD station mapped US cities. Despite some outliers around Rocky Mountain region and Midwest region (where there weren’t that many US ISD stations), we were able to verify ~97% similarity and concluded that weather metrics collected from US ISD stations and mapped to US cities were sufficient for our use case.
In conclusion, we were able to save a lot of money for collecting hourly US weather data at the active US ISD station level. Below are some highlights:
- Collect hourly US weather data on a daily basis with a single API call
- Make API calls for 2,232 active US ISD stations and map it to ~20,000 US cities using the haversine formula
- Lowered our daily estimated cost from ~$480 to $2.232
- Lowered our original estimated backfill cost of 5 years worth of weather data
- from
$480 * 365 days * 5 years = $876,000 - to
$2.232 * 365 days * 5 years = $4,073.40